It has been argued that, in order to collect reliable data with a sampling profiler that peeks at the private VM address space of a process, like Austin, it is necessary to pause the tracee. However, one of the fundamental principles that Austin is based on is: keep perturbations to a minimum. Therefore, pausing the tracee to sample its private VM is not an option on the table. Does this mean that Austin is bound to report unreliable data? My aim with this post it to convince you that halting the tracee is a sufficient condition, but not a necessary one. That is, we can still get pretty accurate results without pausing the tracee every time we want to sample it, provided we are willing to trade in some physical memory.
So how do we leverage some extra memory consumption for increased accuracy? To
understand this we need to review how Austin works, which in turns forces us to
review how Python works when it comes to the frame stack management. When Python
evaluates some bytecode, it creates a frame object that references the code that
is being executed and that holds some useful information. These frames are
referenced by a linked list, which means that, in general, there are no
guarantees as to where in the VM space the frame objects might get allocated.
However, the coding of frame_alloc seems to suggest that
entries in the list might get reused when the become free. So if we keep track
of the addresses as we discover them we could in principle get all the frames
with just a single system call, instead of making a call for each one of them.
But in order to make a single call to the system call to read the private VM of
the tracee we need an address range, which means we need a buffer large enough
to receive the content. The VM address space is huge on a 64-bit architecture so
we cannot really afford to dump an arbitrary range, and therefore we need a
compromise: start getting frame objects and increase the range up to a given
threshold. The hope here is that, with a bit of luck, we start tracking a range
where frame objects are likely to be allocated.
In practical terms, the above solution might still not be good enough. Depending on the allocator that is being used, memory could be allocated anywhere in the massive VM address space. However, some patterns generally emerge: sometimes the address is close to the image in memory of the process, sometimes it is closer to the upper boundary of the allowed user-space VM range. Since the gap in between these two regions could be very big, we could double up the above idea and have two local buffers, one close to the process image in memory, the other closer to the upper boundary of the VM address space. This effectively doubles our chances of dumping frames with just two system calls. When we need to resolve a frame that is not within that range we bite the bullet and make another system call. But, if we are lucky, the overall rate of calls we make should drop considerably with the double-heap trick above, and result accuracy should benefit from it.
So let's see if our theoretical speculations work in reality. The latest release
3.2.0 of Austin comes with a new option, -h/--heap, which allows us to cap the
total amount of double-heap that Austin can allocate to dump frame objects in
one go. Let's try profiling
def sum_up_to(n):
    if n <= 1:
        return 1

    result = n + sum_up_to(n - 1)

    return result


for _ in range(1_000_000):
    N = 16
    assert sum_up_to(N) == (N * (N + 1)) >> 1
with -h 0, i.e. with no heap. This is the picture that we get if we run the
above with the Austin VS Code extension:
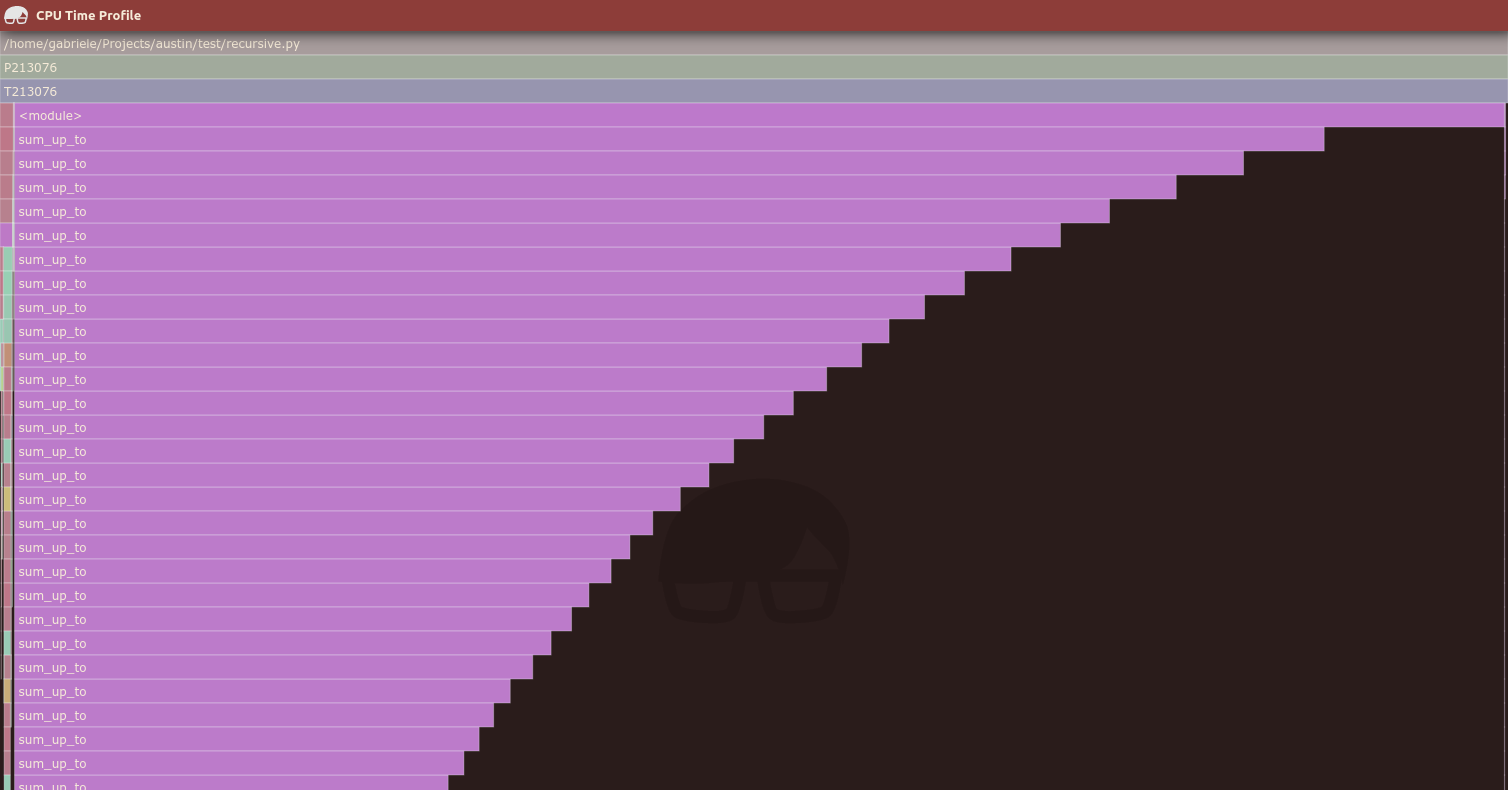
Whilst it is true that most of the CPU time is spent in sum_up_to, we would
have expected a call stack at most 16 frame high in this case. This flame graph
is then misleading, although it still conveys the correct information that
sum_up_to is the largest consumer of CPU time. Let's try again, but with the
default heap size this time (which is 256 MB):
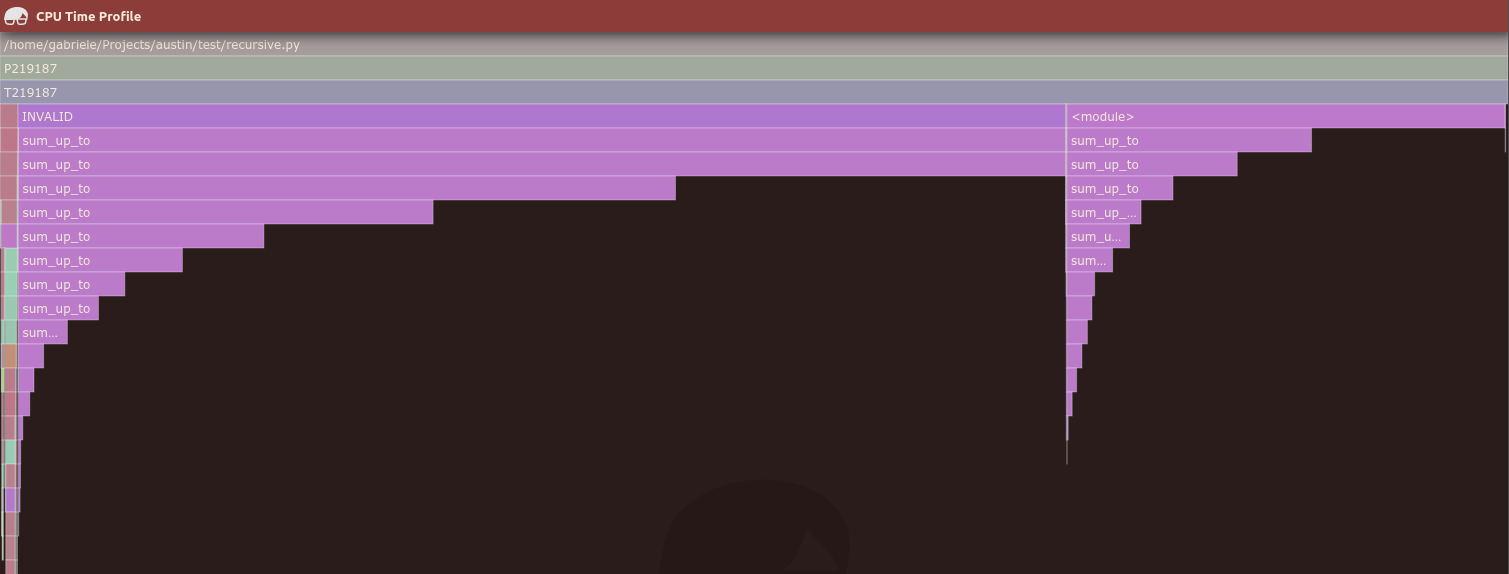
This time the recursive call stack have the expected height, and Austin is able
to tell which samples didn't look quite right. But instead of throwing them
away, they are displayed starting from a parent INVALID frame. Why do we want
to do that? Two reasons: we still account for the total CPU time and we still
have useful information. Even if invalid, those where the frames that got
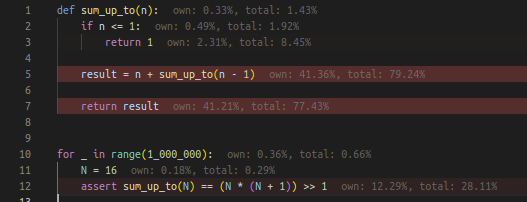
sampled, so some of them must have effectively been running when we sampled.
Collecting that data is therefore useful for other aggregations, like a source
code heat map, like the one produced by the Austin VS Code extension:
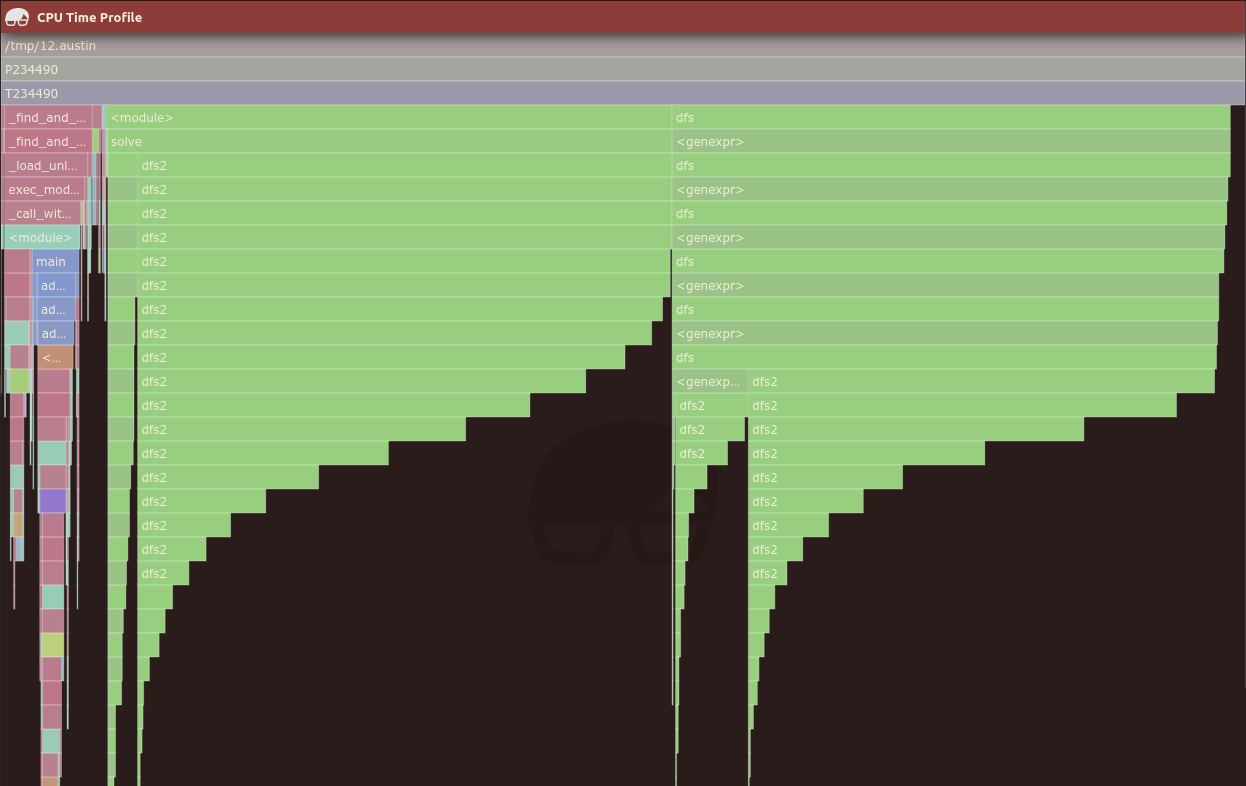
But before we get too hopeful about the merits of this solution, let's have a look at some other examples. The following flame graph comes from profiling my solution for Day 12 of the Advent of Code 2021 challenge with the default heap size:
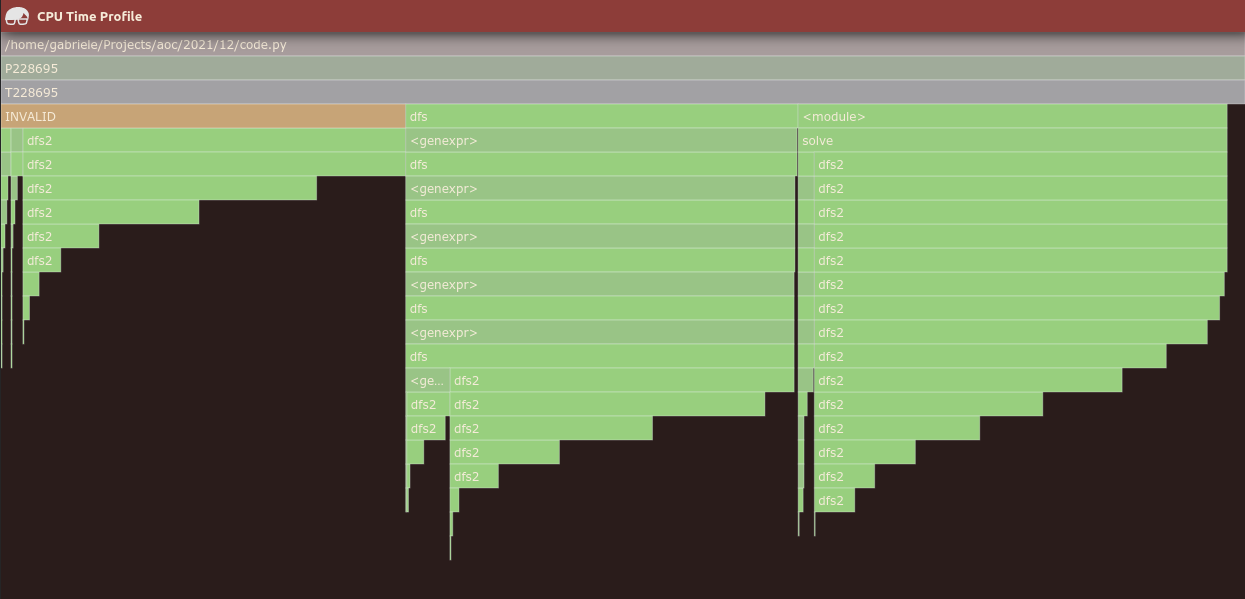
There are clearly invalid frames (those in green that start directly from dfs,
in the middle of the graph) that are not reported as such. For comparison, this
is the resulting graph with no heap:
The conclusion that we draw from these experiments is that the double-heap trick implemented in Austin 3.2 increases the accuracy of the results, in the sense that Austin is better able to detect invalid samples, but there still is the chance of getting invalid samples as valid in the output. However, one thing to notice is that these are quite some artificial examples that involve code that runs pretty quickly. In many practical situations you would be using a profiler to detect unexpected slow paths, where Austin has good chances of producing fairly accurate results. This is the profiling data generated by this simple test script:
import threading


def keep_cpu_busy():
    a = []
    for i in range(2000000):
        a.append(i)


if __name__ == "__main__":
    threading.Thread(target=keep_cpu_busy).start()
    keep_cpu_busy()
with the heap:
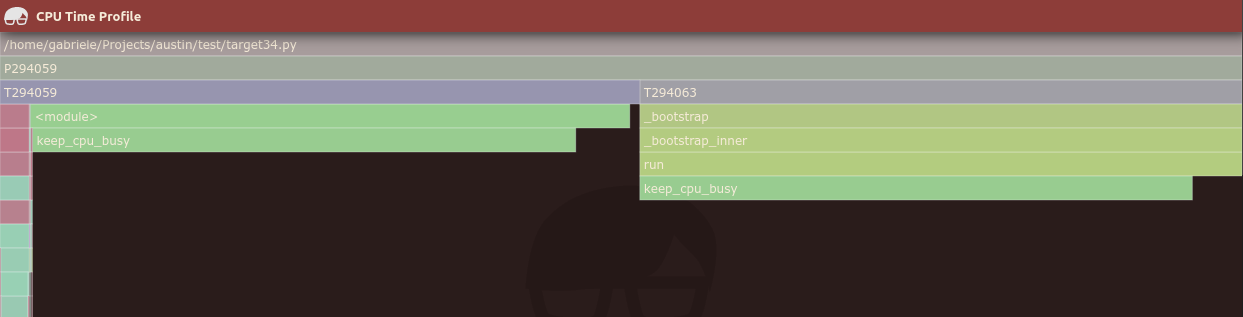
and without:
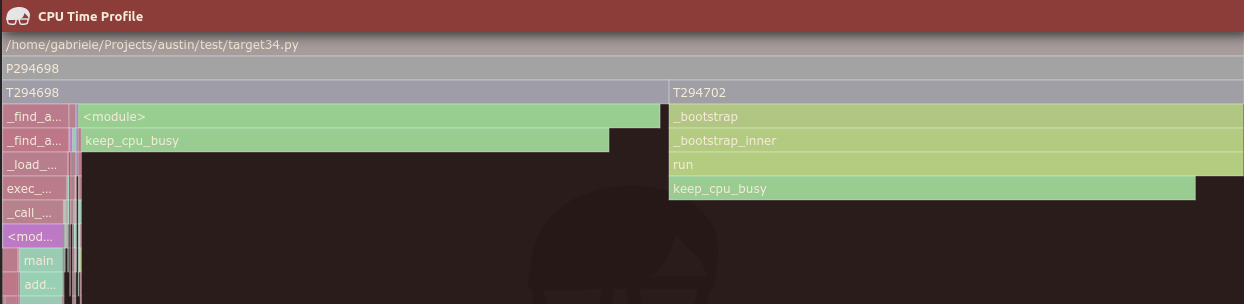
i.e. they're almost identical.
The default value of 256 MB for the maximum combined heap size seems a
reasonable compromise for getting even more accurate results, but on system with
limited resources it is perhaps advisable to run Austin with a lower value, if
not with the more drastic option --heap 0, which gives the pre-3.2 behaviour.